code-profiling-for-optimization
Code profiling for optimization
Section titled “Code profiling for optimization”The Profiling tool helps you to optimize program execution.
When you turn profiling on, the JavaScript engine collects information about a program while it is running. It counts how often the program executed a line or function, or how long it took to execute a line or function. You can choose exactly which profiling data to display.
Profiling Options
Section titled “Profiling Options”Because profiling significantly slows execution time, the Profile menu offers these profiling options.
Profiling turned off.
This is the default.
Functions
Section titled “Functions”The profiler counts each function call.
At the end of execution, displays the total to the left of the line number where the function header is defined.
The profiler counts each time each line is executed.
At the end of execution, displays the total to the left of the line number. Consumes more execution time, but delivers more detailed information.
Add Timing Info
Section titled “Add Timing Info”Instead of counting the functions or lines, records the time taken to execute each function or line.
At the end of execution, displays the total number of microseconds spent in the function or line, to the left of the line number. This is the most time-consuming form of profiling.
No Profiler Data
Section titled “No Profiler Data”When selected, do not display profiler data.
Show Hit Count
Section titled “Show Hit Count”When selected, display hit counts.
Show Timing
Section titled “Show Timing”When selected, display timing data.
Erase Profiler Data
Section titled “Erase Profiler Data”Clear all profiling data.
Save Data As
Section titled “Save Data As”Save profiling data as comma-separated values in a CSV file that can be loaded into a spreadsheet program such as Excel.
Viewing Profiling Info
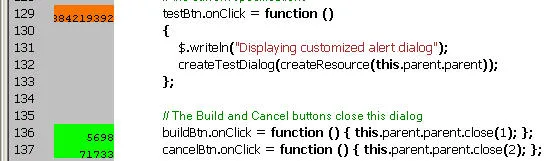
Section titled “Viewing Profiling Info”When execution halts (at termination, at a breakpoint, or due to a runtime error), the Toolkit displays this information in the Document Window, line by line. The profiling data is color coded:
- Green indicates the lowest number of hits, or the fastest execution time.
- Orange or yellow indicates a trouble spot, such as a line that has been executed many times, or which line took the most time to execute.
This example shows number-of-hits information:
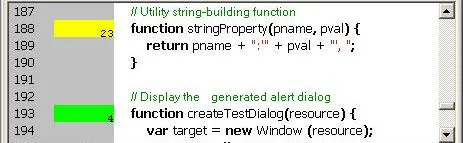
This example displays timing information for the program, in microseconds. The timing might not be accurate down to the microsecond; it depends on the resolution and accuracy of the hardware timers built into your computer.